Simple, hassle-free metrics monitoring.
An alternative metrics monitoring tool that is simple , affordable , and easy-to-use . Deploy metrics monitoring to your services in minutes.
Seriously-good features,
included by default.
- Plug and play
- It takes less than 5 minutes to install and configure our library. After that, you can start sending, analyzing, and reporting on your metrics.
- Unlimited applications
- Add your company site, personal blog, hobby projects, IoT devices or experiments for no additional cost.
- Automated alerting
- Create alerts for your important metrics and get notified when their values aren't trending as you intended.
- Custom metrics
- Capture any metric you want, from the number of daily users in your application to the amount of brown bears you see in Alaska per hour.
- Remarkably easy to use
- Configuration-hell sucks. Polynomal has a very intentional focus which eliminates toil throughout the platform.
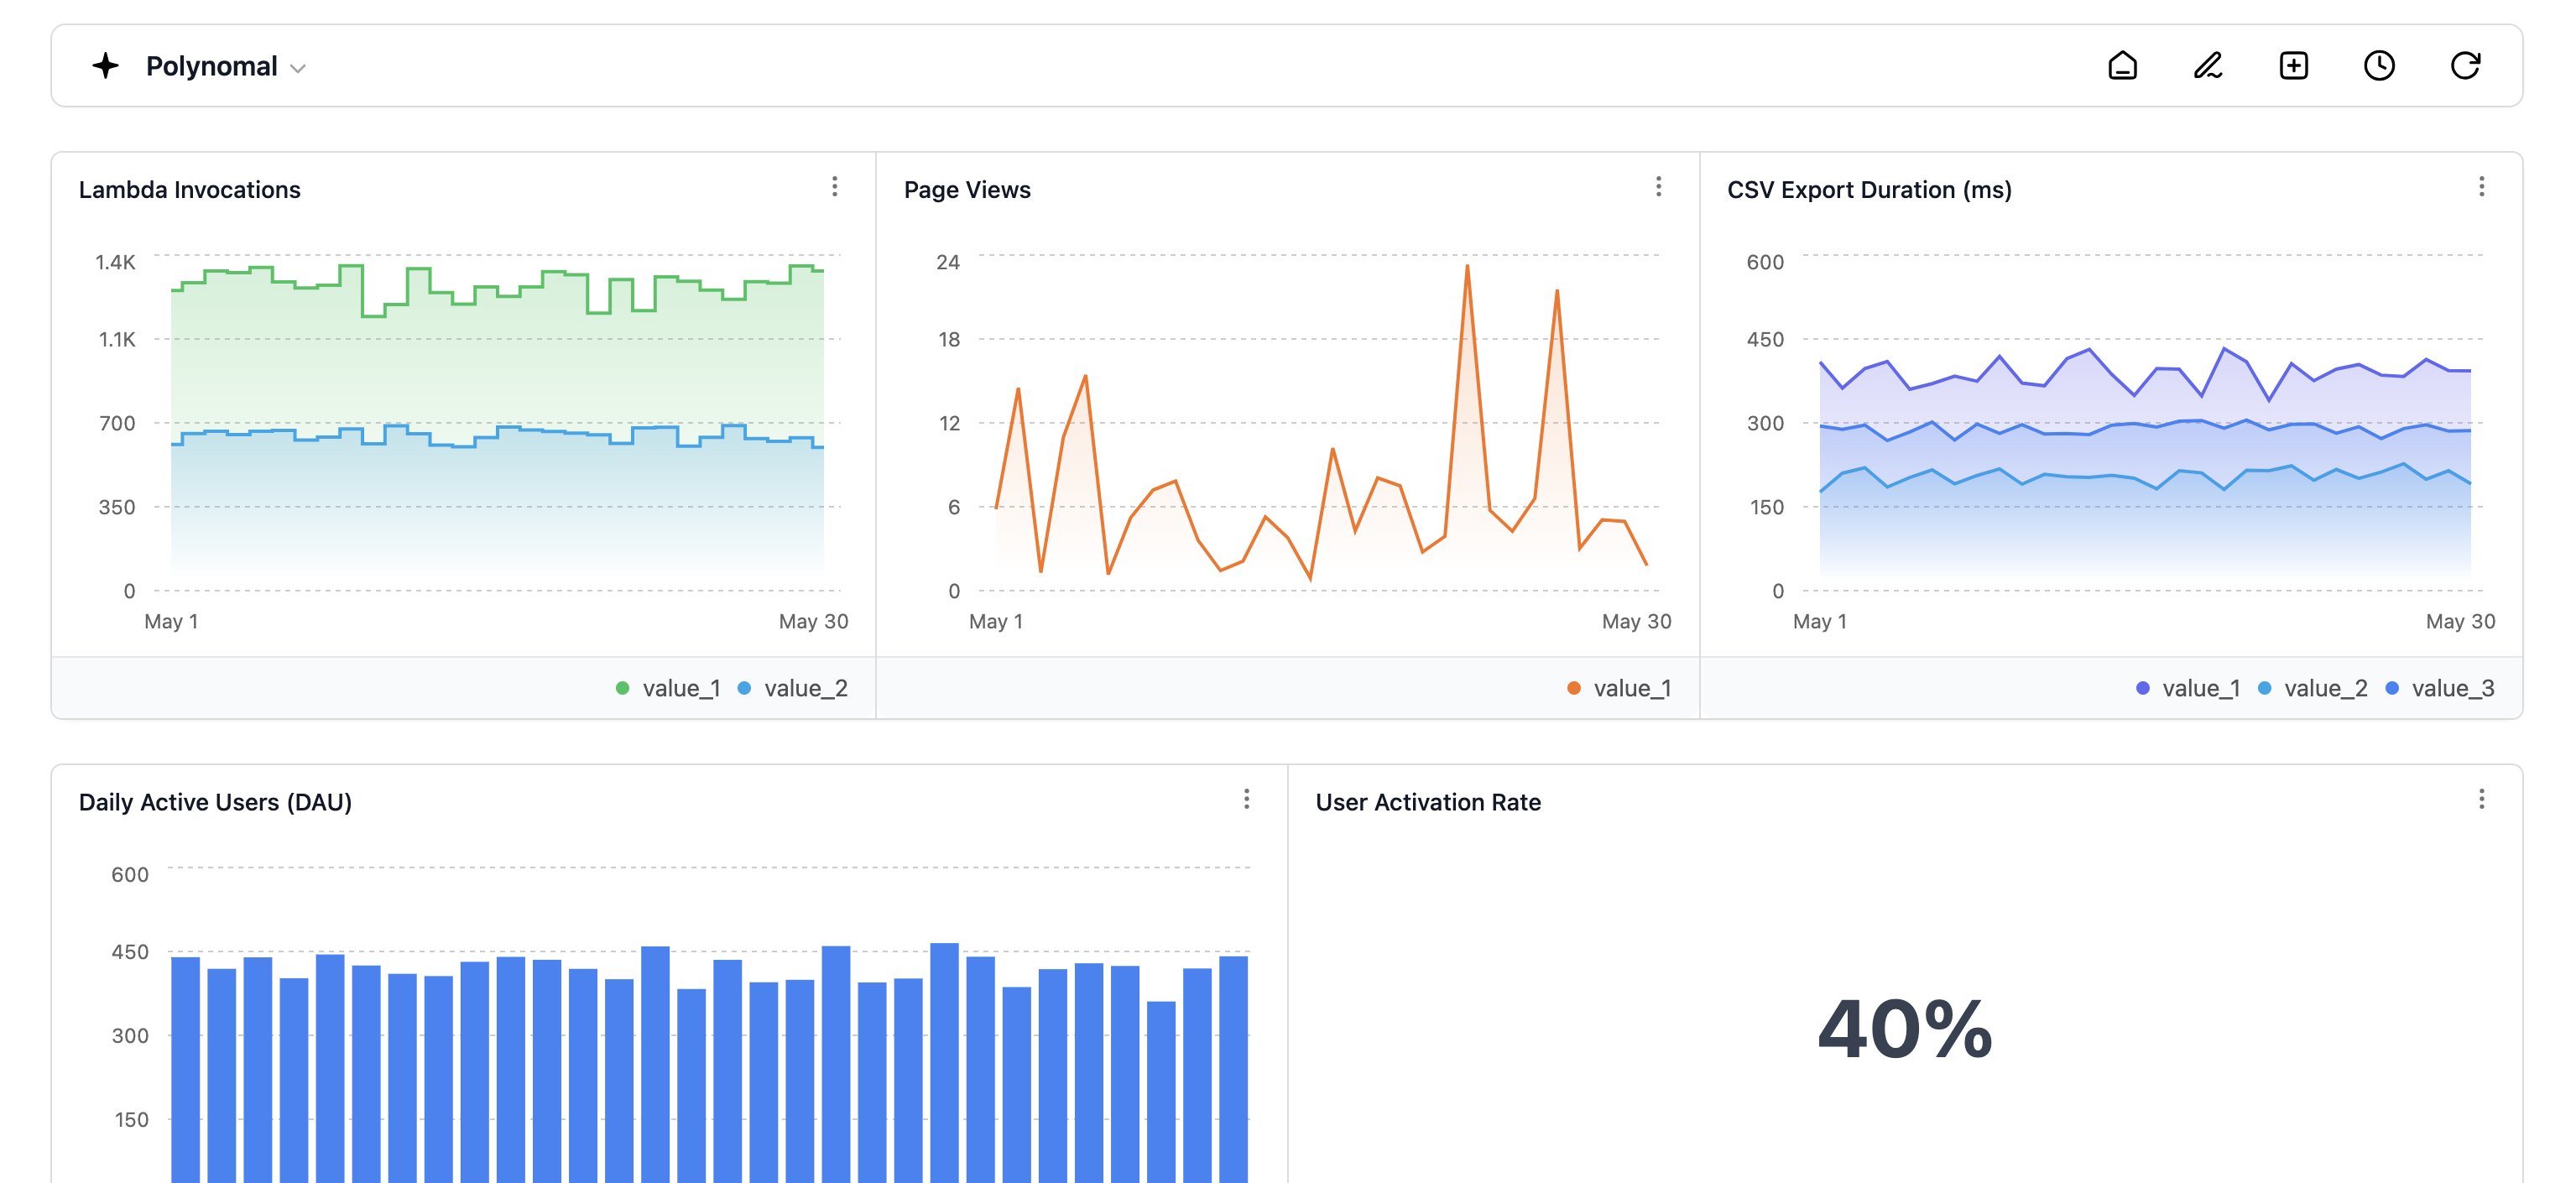
- Custom dashboards
- Display and share your metrics how you wish, in any arrangement, with whoever you want.
- Filter and explore
- Drill into what's most important for you, conduct metric analysis and exploration, or investigate recurring trends.
- Invite your whole team
- Polynomal doesn't charge for extra seats. This way, you can invite whoever you want, even your neighbor, at no additional cost.
Start monitoring your metrics
with Polynomal.
Polynomal isn't quite ready yet, but I'd love for you, a potential customer, to have early access when I am further along in the development cycle. I promise to only send you emails that are actually worth your time.
Frequently asked
questions
Pricing is volume based. Volume is measured by the total number of metrics sent to Polynomal per month across all of your applications. There are no additional costs outside volume.
Yes. You can use it for an unlimited number of applications, scripts, IoT devices, games, etc.
Metrics data is stored for a maximum duration of 1 year.
I will politely ask you to upgrade your plan if you consistently go over your current plan limits. You will recieve multiple emails notifying you about exceeding your limits. You will have multiple opportunities to upgrade. If no action is taken we will automatically upgrade you to the next plan and notify you by email.